
Good morning everyone, I’m Davide Cavallini, Senior Programmer and Penetration Tester
This article was written with the valuable collaboration of Stefano Versace, my former high school mathematics teacher and currently a teacher at the Scientific High School. I thank him very much for participating in the drafting of the article, and also as a teacher.

Giovanni Pollola, a Mechanical Engineering student at the “Luigi Vanvitelli” University, contributed to the writing, whom I thank with all my heart.
Furthermore, it was reviewed by Sergio Corpettini, Advanced Project Engineer, and Giuseppe Longobardi, Cybersecurity Architect & Trainer.
In the previous article, we mathematically addressed the problem of collision of some hashing algorithms, with particular reference to file integrity checks.
This time we will see a practical example of the application of mathematics in the field of programming.
I often remember that students neglected some subjects, claiming that “usually in programming simple calculations are made, such as sums and remainders”, but it is not always so. It is essential to master some key concepts, purely mathematical, to have the ability to produce through these practical useful devices, and sometimes even indispensable, for programming purposes. When we study, especially in high schools, we often get an idea of “what we would like to do when we grow up”, but then we don’t actually know where we will end up.
Similarly to the laws of quantum mechanics, the universe presents infinite possibilities and we will “fall” with a certain probability into a precise job, but we never know well which one, unless we inherit our parents’ job (notary, lawyer, owner of the father’s factory, noble, etc.). There may be an opportunity to have to do complex calculations, as in quantum computation, or to work on mechanics, or in aerospace agencies, and if you were devoid of advanced mathematical knowledge, you would certainly have to give up.
So, the way I see it, it’s always worth it to commit to studying, and to always continue to do so in one’s own life.
Today we will immerse ourselves in a fascinating world where mathematics and programming merge to solve real problems in a creative and passionate way. In our journey, we will explore the interesting connection between these two disciplines and how together they can open doors to innovative solutions.
Our compelling example revolves around the vast universe of car insurance and the use of speed data from a satellite navigation app. Imagine having to calculate the acceleration, deceleration, maximum speed, and distance traveled by a vehicle in a certain time interval. Does it seem difficult? Well, we will use the PHP programming language and OpenOffice Calc software to simplify the process and make everything more accessible and fun.
We will guide you through the creation of a speed-time graph, where we will apply mathematical concepts such as derivative and integral to obtain the desired information. We will explain the magic behind the derivative, the incremental ratio, the definite and indefinite integral, and even the mysterious Riemann sum. But don’t worry, we will do it with practical examples, mathematical formulas, and a good dose of enthusiasm!
The importance of studying and deepening your understanding of mathematics will be our final message. We encourage you to seize the skills necessary to successfully face future challenges. We will conclude our journey by emphasizing how your commitment to studying these subjects can open the doors to a world of opportunities.
Get ready for an intellectual adventure that will make you appreciate the power of mathematics and programming in shaping our world!
Now that I’ve finished giving you a lecture, let’s look at an example, or case study as they call it now, in which it might be necessary to perform quite advanced calculations.
The case is as follows:
For this experiment, we write the program in PHP using this site: https://php-play.dev
Each index $s of the $speed array corresponds to a 1-second step on the time axis, otherwise I would have had to use two lists, one for time and one for speed, but I wanted to simplify for a better understanding of the article.
Summarizing the concept:
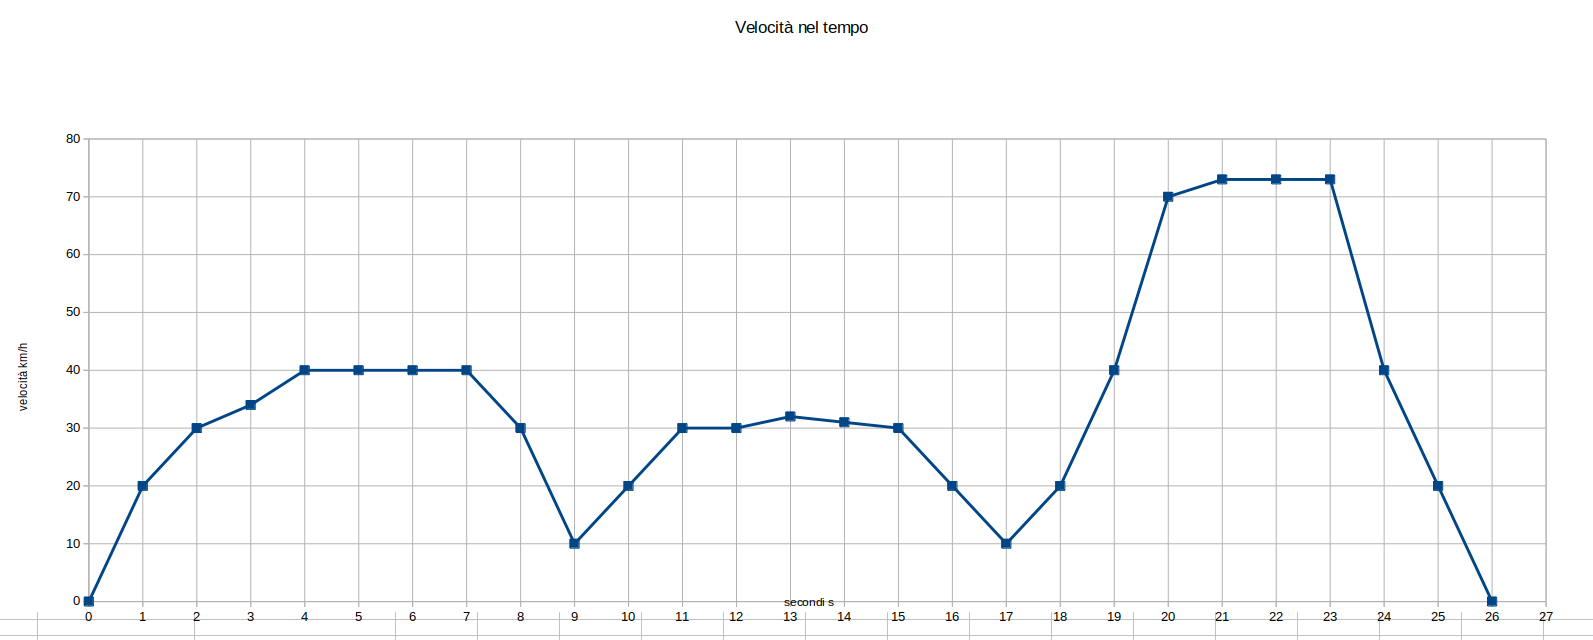
We declare the $speed array (in red). The values on the y-axis (km/h) in this case are as follows:
$speed = [0,20,30,34,40,40,40,40,30,10,20,30,30,32,31,30,20,10,20,40,70,73,73,73,40,20,0];
In PHP, as in almost all programming languages, array indices start from 0.
So, when we say speed[0], we are referring to the first element of the array speed, which represents the speed at the instant s=0.
When we say speed[1], we are referring to the second element of the array, which represents the speed at the instant s=1, and so on.
Here is a more detailed example with the first three indices:
By counting the size of the array, that is, the total number of elements (indices) within speed, we can know what the last index will be, that is, the size of the array minus one. To calculate the size, use the count(array) function.
So we write in the PHP editor:
$arraySize = count($speed);
In this way, we see that the list contains 27 elements, and since the index does not start from 1 but from 0, the last index will be 26 (size – 1).
This means that we can go up to a maximum of $speed[26].
Now let’s tackle the problems one by one.
First, we need to find the moment of maximum acceleration, or more precisely, the time interval of maximum acceleration.
Let’s build a graph with time on the horizontal axis and speed on the vertical axis of these points with OpenOffice Calc, a software similar to Excel where you can enter data.
To report the speed values in the spreadsheet, I need them to be written in a column.
So to avoid copying them one by one from the list above, I take advantage of the programming language to write them in a column, using the “foreach” loop.
foreach($speed as $speed){
   echo $speed;
   echo "<br>";
}
PHP shows us these lines to copy into OpenOffice Calc:
0
20
30
34
40
40
40
40
30
10
20
30
30
32
31
30
20
10
20
40
70
73
73
73
40
20
0
Okay, we copy all the speed values into column A of Calc.
It’s important to say that in this case I only inserted the speed values because the step of the time vector is always one, and OpenOffice Calc uses natural numbers by default on the x-axis. Otherwise, you would have to insert both columns and use the scatter plot (which is called XY in Calc).
Now we select all the rows of column A, and go to Insert > Chart.
We select the line chart type without additional options
We continue to always go forward and in Step 4 we put:
x-axis: s (seconds)
y-axis: km/h (kilometers per hour)
In the end, we get the following result:
To understand the meaning of the graph, let’s analyze some situations, keeping in mind that acceleration represents the slope of the speed graph.
For example, between 0 seconds and 1 second, the speed increases, and you can see in the graph that moving from left to right, the graph goes uphill. The climb means that the acceleration is positive, so the sign will be +. Between 1 and 2, it is still positive, but it has a lower numerical value because the graph is less steep.
Conversely, for example in the interval between 8 and 9, the segment that connects the two points from left to right goes downhill, so the acceleration is negative (sign -).
So clearly, the greatest acceleration is where the graph rises most “steeply”.
Conversely, the graph has an increasingly steep slope downwards (sign -) as the deceleration (or braking) becomes stronger.
To be more precise, the moments of greatest acceleration and deceleration are found with DERIVATIVES (to be even more precise with first derivatives).
If we look at the formal definition of a derivative at a point, it is indeed indicated as “the limit of the incremental ratio of the function at that point as the increment tends to zero”.
The derivative is that function which associates to each point the value of the derivative at that point.
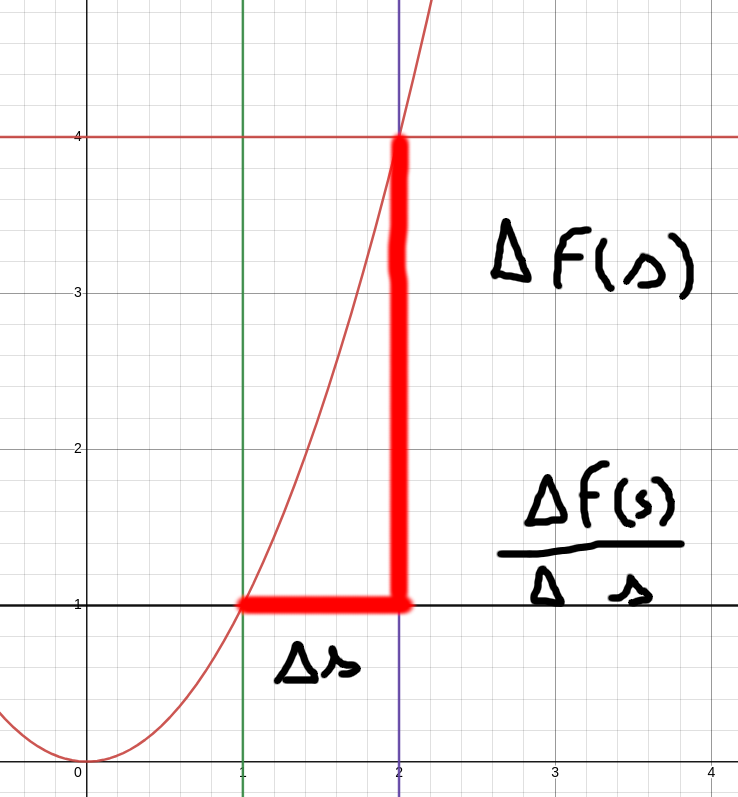
To arrive at the concept of a derivative, however, it is necessary to go through the concept of an incremental ratio.
In our case, the time values, indicated with s, are discrete rather than continuous. Since we cannot make the distance between them tend to zero (we will see what this means later), I choose to evaluate the incremental ratio on the minimum distance they can have from each other. This distance is called a step, which in our case is constantly 1 between one instant s and the next.
At this point, we draw on the axis parallel to the time axis (s) the segment that connects (a, h), and on the axis parallel to the speed one we draw the segment (h,b). In this way, a right triangle is formed, so:
In the case of our speed over time graph, this ratio indicates the average acceleration between the two “instants”, or the average derivative between two points.
If time varied continuously, that is, if I could evaluate the speed at every moment, such as at second 2.000000000001, and therefore if the function were continuous, as in the case of , clearly, the differences in time (Δs) could become so close to zero, tending to the limit, that they would become infinitesimal. In this case, the DELTA (Δ) would be called a differential, and would be indicated with the letter
.
You were probably taught that a tangent touches a curve at only one point, and this is correct. However, if we examine the concept more closely, we see that the tangent can be seen as a secant that passes through two points on the curve that are so close to each other that their distance becomes infinitesimal. In other words, the two points get so close that they seem like a single point. This is the foundation of infinitesimal calculus and the concept of a derivative.
Clearly, in our case, since the step is 1, we cannot act with differential calculations. Since we only know the discrete values, we cannot obtain the EXACT DERIVATIVE (or instantaneous derivative), but only the average derivative, which is the average slope in an interval, which can also be simply indicated as an incremental ratio.
Example of incremental ratio between two random points of the function :
Now if we replace s with numbers, and calculate the incremental ratios in the first intervals, we get:
Δf(s) = 1-0 1
____________ = __ = 1
Δs = 1-0 1
Δf(s) = 4-1 3
____________ = __ = 3
Δs = 2-1 1
Δf(s) = 9-4 5
___________ = __ = 5
Δs = 3-2 1
Δf(s) = 16-9 7
____________ = __ = 7
Δs = 4-3 1
So the incremental ratio (slope) increases LINEARLY by 2 units for each ‘step’. We can see this incremental ratio as a secant line between the two points.
By taking the limit towards zero of one of the intervals until we obtain an infinitesimal distance, we obtain the EXACT derivative of , which at any point is equal to 2s.
This means that at s=2 the derivative (thus the slope or tangent) will be equal to 4, while at s=6 it will be equal to 12, at s=8 it will be equal to 16, and so on. Clearly, since the graph is a simple function, it is very easy to calculate the exact derivative using the rules of the so-called ‘fundamental derivatives’.
So, let’s create a loop that calculates the incremental ratio for each Δs.
Therefore, we should:
Let’s create a loop to perform this operation. The most “natural” and simple loop that can be used in my opinion is the while loop.
<?php
//let's resume the previous code


//km/h values for each second
$speed = [0, 20, 30, 34, 40, 40, 40, 40, 30, 10, 20, 30, 30, 32, 31, 30, 20, 10, 20, 40, 70, 73, 73, 73, 40, 20, 0];


//count the elements of the array
$arraySize = count($speed);


//initialize the variable of the starting s index
$s_index = 0;


//the condition is that s_index is less than the elements of s (arraySize) - 1
while ($s_index < ($arraySize - 1)) {


  //index of the increment of f(s)
  $h = $s_index + 1;


  //delta s will always be 1 s
  $delta_s = 1;


  //delta f(s)
  $delta_speed_s = $speed[$h] - $speed[$s_index];


  //calculate the incremental ratio
  $incremental = $delta_speed_s / $delta_s;


  echo $incremental . ", ";


  //increase the index
  $s_index = $h;
}
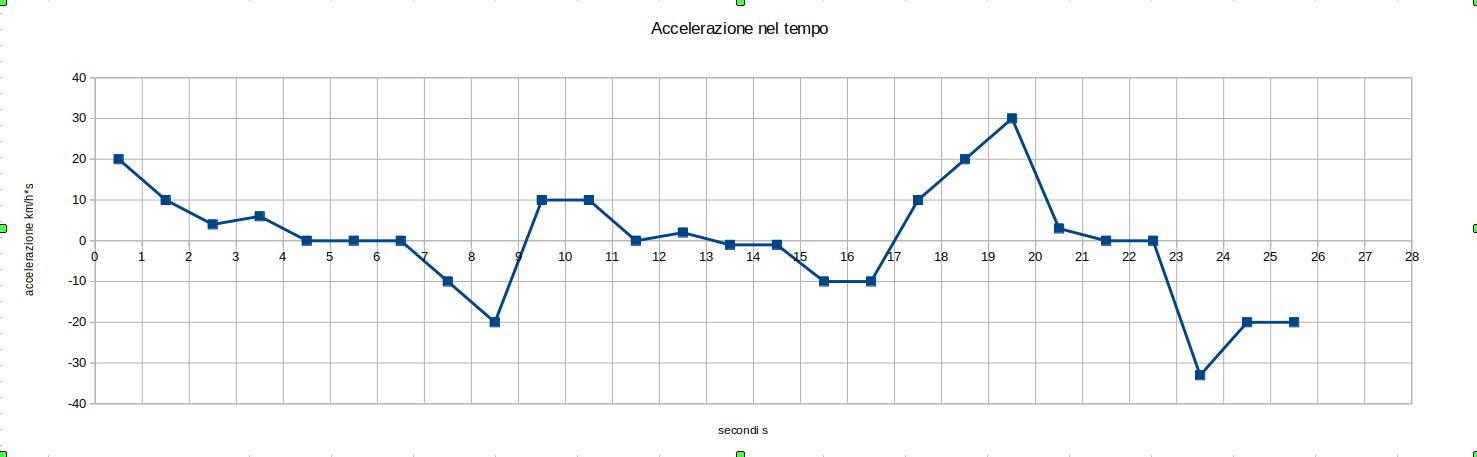
Executing this code, I get the following incremental ratios:
20, 10, 4, 6, 0, 0, 0, -10, -20, 10, 10, 0, 2, -1, -1, -10, -10, 10, 20, 30, 3, 0, 0, -33, -20, -20
The maximum acceleration is at the point where the incremental ratio is most positive. Let’s insert a variable to store the maximum value found.
The point where the incremental ratio will be most negative is where there is the maximum deceleration. Let’s insert a variable to store the minimum value found (below zero).
<?php
//let's resume the previous code
//km/h values for each second
$speed = [0, 20, 30, 34, 40, 40, 40, 40, 30, 10, 20, 30, 30, 32, 31, 30, 20, 10, 20, 40, 70, 73, 73, 73, 40, 20, 0];
//count the elements of the array
$arraySize = count($speed);
$incrementalList = [];
//maximum and minimum
$max_accel=0;
$max_decel=0;
//initialize the variable of the starting s index
$s_index = 0;
//the condition is that s_index is less than the elements of s (arraySize) - 1
while ($s_index < ($arraySize - 1)) {
//index of the increment of f(s)
$h = $s_index + 1;
//delta s will always be 1 s
$delta_s = 1;
//delta f(s)
$delta_speed_s = $speed[$h] - $speed[$s_index];
//calculate the incremental ratio
$incremental = $delta_speed_s / $delta_s;
if($incremental>$max_accel){
$max_accel=$incremental;
}
if($incremental<$max_decel){
$max_decel=$incremental;
}
//modify to return an array at the end
$incrementalList[]=$incremental;
//increase the index
$s_index = $h;
}
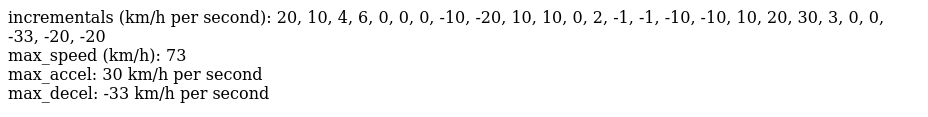
echo "incrementals (km/h per second): " . join(', ',$incrementalList);
echo "<br>";
echo "max_accel: ". $max_accel. " km/h per second";
echo "<br>";
echo "max_decel: ". $max_decel. " km/h per second";
Already with these changes in red, by running the script, we get the following result:

We’re already halfway there.
The next request is to find the maximum speed, which is very easy by analyzing all the elements of speed. I insert the code modification in red:
<?php


//km/h values for each second
$speed = [0, 20, 30, 34, 40, 40, 40, 40, 30, 10, 20, 30, 30, 32, 31, 30, 20, 10, 20, 40, 70, 73, 73, 73, 40, 20, 0];


//count the elements of the array
$arraySize = count($speed);


if($arraySize ==0){
  exit;
}


$max_speed=$speed[0];


$incrementalList = [];


//maximum and minimum
$max_accel=0;
$max_decel=0;


//initialize the variable of the starting s index
$s_index = 0;


//the condition is that s_index is less than the elements of s (arraySize) - 1
while ($s_index < ($arraySize - 1)) {


 $actual_speed=$speed[$s_index];


 if($actual_speed>$max_speed){
  $max_speed=$actual_speed;
 }


 //index of the increment of f(s)
 $h = $s_index + 1;


 //delta s will always be 1 s
 $delta_s = 1;


 //delta f(s)
 $delta_speed_s = $speed[$h] - $actual_speed;


 //calculate the incremental ratio
 $incremental = $delta_speed_s / $delta_s;


 if($incremental>$max_accel){
    $max_accel=$incremental;
 }


 if($incremental<$max_decel){
    $max_decel=$incremental;
 }


 //modify to return an array at the end
 $incrementalList[]=$incremental;


 //increase the index
 $s_index = $h;
}


echo "incrementals (km/h per second): " . join(', ',$incrementalList);
echo "<br>";
echo "max_speed (km/h): " . $max_speed;
echo "<br>";
echo "max_accel: ". $max_accel. " km/h per second";
echo "<br>";
echo "max_decel: ". $max_decel. " km/h per second";
By running the script, we get the following result:
The next request is to find the momentary peaks of maximum speed between each acceleration change.
If the function were continuous, it would make more sense to start with the calculation of the second derivative (derivative of the first derivative) to find the critical points.
However, since we are in a function with discrete values, and the second derivative itself could mistake a flex point (a flat curve) for a local maximum, and it is even less precise in functions with discrete values, in this case we use another approach which I think is much better, that is the moment at which the sign changes (i.e., the direction of the curve in the graph).
So, reasoning about it:
This is based on the fact that at a local maximum point, the slope of the function is positive before the point and becomes negative after, while at a local minimum point, the slope is negative before the point and becomes positive after.
Let’s modify the code in red to discover the local maxima:
<?php


//km/h values for each second
$speed = [0, 20, 30, 34, 40, 40, 40, 40, 30, 10, 20, 30, 30, 32, 31, 30, 20, 10, 20, 40, 70, 73, 73, 73, 40, 20, 0];


//count the elements of the array
$arraySize = count($speed);


if ($arraySize == 0) {
  exit;
}


$max_speed = $speed[0];


$incrementalList = [];
$localMaxima = [];


//maximum and minimum
$max_accel = 0;
$max_decel = 0;


//initialize the variable of the starting s index
$s_index = 0;


$previousSign = "=";


//the condition is that s_index is less than the elements of s (arraySize) - 1
while ($s_index < ($arraySize - 1)) {


  $actual_speed = $speed[$s_index];


  if ($actual_speed > $max_speed) {
      $max_speed = $actual_speed;
  }


  //index of the increment of f(s)
  $h = $s_index + 1;


  //delta s will always be 1 s
  $delta_s = 1;


  //delta f(s)
  $delta_speed_s = $speed[$h] - $actual_speed;


  //calculate the incremental ratio
  $incremental = $delta_speed_s / $delta_s;


  if ($incremental < 0 && $previousSign != "-") {
      $localMaxima[] = $actual_speed;
      $previousSign = "-";
  } else if ($incremental > 0 && $previousSign != "+") {
      $previousSign = "+";
  }


  if ($incremental > $max_accel) {
      $max_accel = $incremental;
  }


  if ($incremental < $max_decel) {
      $max_decel = $incremental;
  }


  //modify to return an array at the end
  $incrementalList[] = $incremental;


  //increase the index
  $s_index = $h;
}


echo "speeds (km/h): " . join(', ', $speed);
echo "<br>";
echo "<br>";
echo "incrementals (km/h per second): " . join(', ', $incrementalList);
echo "<br>";
echo "<br>";
echo "localMaxima (km/h): " . join(', ', $localMaxima);
echo "<br>";
echo "<br>";
echo "max_speed (km/h): " . $max_speed;
echo "<br>";
echo "<br>";
echo "max_accel: " . $max_accel . " km/h per second";
echo "<br>";
echo "<br>";
echo "max_decel: " . $max_decel . " km/h per second";
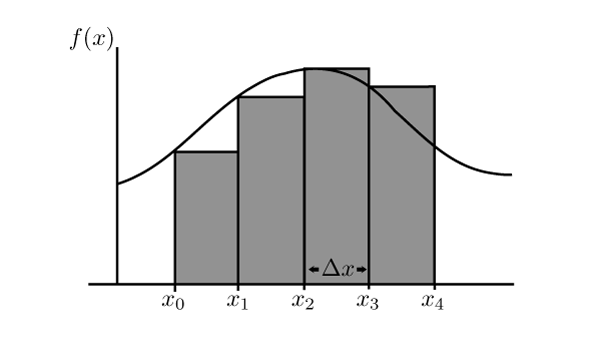
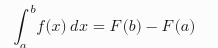
The last request is to find the distance traveled (assuming it is in meters) from second a to second b. To do this, anyone familiar with mathematics would certainly know that you need to integrate, or find the area under the graph.
To avoid inconsistencies between units of measure, I must first convert the reference second into an hour, since I have speeds in kilometers per hour.
So I need to divide a second by 3600 and multiply it by km/h, thus obtaining the space traveled in that time and perform the summation with all other intervals.
The integral is nothing more than the summation of all deltas in the interval (a,b) with respect to s (the seconds), in our case, multiplied by the function in s in all the deltas of the interval.
In the integral, however, instead of the delta, a differential is used, so the integral is actually a sum of the products between the differentials and the function in s at those points.
For this reason, the definite integral is indicated as “the sum of a number of partitions tending to infinity in a defined interval”.
In practice, it is like summing many very thin rectangles one after the other, under the curve of the graph. This procedure is also called “Riemann summation”.
Caption: Example of Riemann Sum.
NB If the areas of the intervals are under the curve, the sum is said to be “lower”, therefore it corresponds to the underestimated area of the curve. If the areas of the intervals exceed the curve, the sum is said to be “upper”, therefore it is the overestimated area of the function. To calculate the precise area, the lower and upper sums must correspond. To be corresponding or well approximated, the partitions of the interval must be as large as possible, so it is said that they “tend to infinity”, that is, they tend to an infinite number of partitions.
The symbol of the integral is an S, written as ∫, which stands for a “sum”, and a different symbol is used to distinguish it from the normal summation, which is indicated with Σ (sigma).
In this case, since the deltas at the limit tending to 0 are NOT infinitesimal, but are discrete (1 second), the integral will take the form of a summation between the various intervals for their function.
So, for the partition, I will take the area of the right triangle from where the incremental ratio was calculated + the area of the rectangle below, and after saving it in a list, I calculate the difference between: the sum of the indices up to b the sum of the indices up to a
By doing so, we will find the definite integral, that is, the area between two discrete intervals, in this case.
If you integrate an acceleration expressed with respect to time, you get the function of velocity with respect to time. Conversely, if you derive the velocity with respect to time, you get the acceleration with respect to time.
The fact that the integral is the inverse of the derivative is always true, and obviously, the converse is also true.
So, the following equation is always true, and it is known as the “Fundamental Theorem of Integral Calculus”:
Indeed:
The indefinite integral is a family of functions, each of which has f as its derivative.
Now, think of each person as a function. Each function is unique, but all functions in a “family of functions” share some common characteristics that bind them together as a family. These common characteristics might be the general shape of the function, or the way the function behaves, or a particular mathematical property.
To be more specific, the indefinite integral always belongs to the set of real numbers, and therefore it can generally only be calculated in continuous functions, except for special cases, and it always ends with + c, because deriving the primitive, the derivative always loses the constant.
In fact, constant values in the graph would be represented by a flat line, so slope 0, so it would remain + 0 in the derived function.
So the definite integral always carries with it the whole family of constants of the primitive function.
<?php
//km/h values for each second
$speed = [0, 20, 30, 34, 40, 40, 40, 40, 30, 10, 20, 30, 30, 32, 31, 30, 20, 10, 20, 40, 70, 73, 73, 73, 40, 20, 0];
//count the elements of the array
$arraySize = count($speed);
if ($arraySize == 0) {
exit;
}
$max_speed = $speed[0];
$incrementalList = [];
$intervalAreas = [];
$localMaxima = [];
//maximum and minimum
$max_accel = 0;
$max_decel = 0;
//initialize the variable of the starting s index
$s_index = 0;
$previousSign="=";
//the condition is that s_index is less than the elements of s (arraySize) - 1
while ($s_index < ($arraySize - 1)) {
$actual_speed = $speed[$s_index];
if ($actual_speed > $max_speed) {
$max_speed = $actual_speed;
}
//interval of increment of f(s) = 1 second
$h = $s_index + 1;
//delta s will always be 1 s
$delta_s = 1;
//delta f(s)
$delta_speed_s = $speed[$h] - $actual_speed;
//calculate the incremental ratio
$incremental = $delta_speed_s / $delta_s;
if($incremental<0 && $previousSign!="-"){
$localMaxima[]=$actual_speed;
$previousSign="-";
}else if($incremental>0 && $previousSign!="+"){
$previousSign="+";
}
if ($incremental > $max_accel) {
$max_accel = $incremental;
}
if ($incremental < $max_decel) {
$max_decel = $incremental;
}
//modify to return an array at the end
$incrementalList[] = $incremental;
//rectangle base area + triangle area above
if ($delta_speed_s > 0) {
$baseRectangleHeight = $actual_speed;
} else {
$baseRectangleHeight = $speed[$h];
}
$baseRectangleArea = $delta_s * $baseRectangleHeight;
$triangleArea = $delta_s * abs($delta_speed_s) / 2;
$intervalArea = $baseRectangleArea + $triangleArea;
//convert hours to seconds (multiplying by 3600) to know the km traveled in the interval
//divide by 1000 to know the meters traveled in that interval
$intervalAreas[] = $intervalArea * 1000 / 3600;
//increase the index
$s_index = $h;
}
function areaBelowCurve($from_index_a, $to_index_b)
{
global $intervalAreas;
$sum_b = array_sum(array_slice($intervalAreas, 0, $to_index_b));
$sum_a = array_sum(array_slice($intervalAreas, 0, $from_index_a));
return round($sum_b - $sum_a, 2);
}
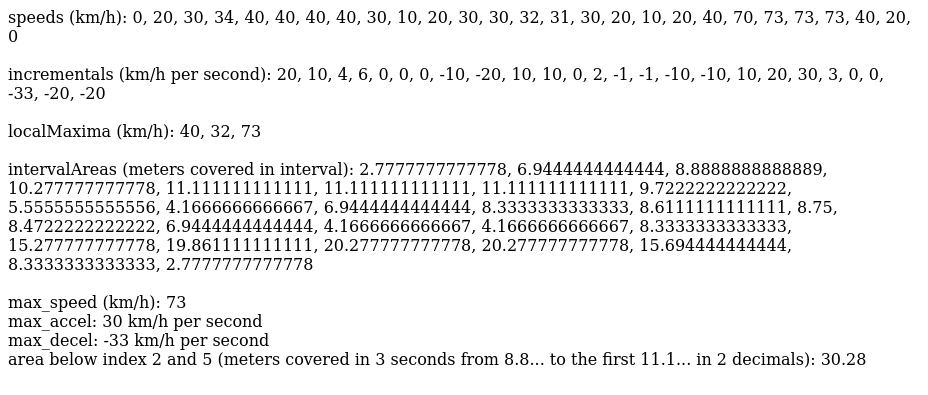
echo "speeds (km/h): " . join(', ', $speed);
echo "<br>";
echo "<br>";
echo "incrementals (km/h per second): " . join(', ', $incrementalList);
echo "<br>";
echo "<br>";
echo "localMaxima (km/h): " . join(', ', $localMaxima);
echo "<br>";
echo "<br>";
echo "intervalAreas (meters covered in interval): " . join(', ', $intervalAreas);
echo "<br>";
echo "<br>";
echo "max_speed (km/h): " . $max_speed;
echo "<br>";
echo "max_accel: " . $max_accel . " km/h per second";
echo "<br>";
echo "max_decel: " . $max_decel . " km/h per second";
echo "<br>";
echo "area below index 2 and 5 (meters covered in 3 seconds from 8.8... to the first 11.1... in 2 decimals): " . areaBelowCurve(2, 5);
echo "<br>";
For completeness, I finish by rewriting the optimized code, since it was previously simplified in the hope of a better understanding by everyone.
I have also added some very useful features, such as the indices that correspond in our case to the moments in time when we found a certain speed value.
<?php


class Maps
{
   /**
    * @var array<int,float>
    */
   private array $speed = [];


   /**
    * @var array<int,float>
    */
   private array $incrementalList = [];


   /**
    * @var array<int,float>
    */
   private array $intervalAreas = [];


   /**
    * @var array<int,int>
    */
   private array $localMaximaIndexes = [];


   /**
    * @var array<int,float>
    */
   private array $localMaxima = [];


   private float $maxAcceleration = 0;
   private int $maxAccelerationIndex = 0;
   private float $maxDeceleration = 0;
   private int $maxDecelerationIndex = 0;
   private int $maxSpeedIndex = 0;
   private float $maxSpeed = 0;
   private string $previousSign = '=';


   /**
    * Constructor.
    *
    * @param array<int,float> $speed
    */
   public function __construct($speed)
   {
       $this->speed = $speed;


       $this->analyseValues();
   }


   public function areaBelowCurve(int $from_index_a, int $to_index_b): float
   {
       $sum_b = array_sum(array_slice($this->intervalAreas, 0, $to_index_b));


       $sum_a = array_sum(array_slice($this->intervalAreas, 0, $from_index_a));


       return round($sum_b - $sum_a, 2);
   }


   /**
    * @return array<int,float>
    */
   public function getSpeed()
   {
       return $this->speed;
   }


   /**
    * @return array<int,float>
    */
   public function getIncrementalList()
   {
       return $this->incrementalList;
   }


   /**
    * @return array<int,int>
    */
   public function getLocalMaximaIndexes()
   {
       return $this->localMaximaIndexes;
   }


   /**
    * @return array<int,float>
    */
   public function getLocalMaxima()
   {
       return $this->localMaxima;
   }


   /**
    * @return array<int,float>
    */
   public function getIntervalAreas()
   {
       return $this->intervalAreas;
   }


   public function getMaxSpeedIndex(): int
   {
       return $this->maxSpeedIndex;
   }


   public function getMaxSpeed(): float
   {
       return $this->maxSpeed;
   }


   public function getMaxAccelerationIndex(): int
   {
       return $this->maxAccelerationIndex;
   }


   public function getMaxAcceleration(): float
   {
       return $this->maxAcceleration;
   }


   public function getMaxDecelerationIndex(): int
   {
       return $this->maxDecelerationIndex;
   }


   public function getMaxDeceleration(): float
   {
       return $this->maxDeceleration;
   }


   private function analyseValues(): void
   {
       $arraySize = count($this->speed);


       if ($arraySize < 1) {
           throw new \Exception('You must have at least 1 value');
       }


       $this->maxSpeed = $this->speed[0];


       $delta_s = 1;


       for ($s_index = 0; $s_index < $arraySize - 1; $s_index += $delta_s) {
           $actual_speed = $this->speed[$s_index];


           if ($actual_speed > $this->maxSpeed) {
               $this->maxSpeed = $actual_speed;
               $this->maxSpeedIndex = $s_index;
           }


           $h = $s_index + $delta_s;


           $delta_speed_s = $this->speed[$h] - $actual_speed;


           $incremental = $delta_speed_s / $delta_s;


           if ($incremental < 0 && '-' != $this->previousSign) {
               $this->localMaxima[] = $actual_speed;
               $this->localMaximaIndexes[] = $s_index;
               $this->previousSign = '-';
           } elseif ($incremental > 0 && '+' != $this->previousSign) {
               $this->previousSign = '+';
           }


           if ($incremental > $this->maxAcceleration) {
               $this->maxAcceleration = $incremental;
               $this->maxAccelerationIndex = $s_index;
           }


           if ($incremental < $this->maxDeceleration) {
               $this->maxDeceleration = $incremental;
               $this->maxDecelerationIndex = $s_index;
           }


           $this->incrementalList[] = $incremental;


           if ($delta_speed_s > 0) {
               $baseRectangleHeight = $actual_speed;
           } else {
               $baseRectangleHeight = $this->speed[$h];
           }


           $baseRectangleArea = $delta_s * $baseRectangleHeight;


           $triangleArea = $delta_s * abs($delta_speed_s) / 2;


           $intervalArea = $baseRectangleArea + $triangleArea;


           $this->intervalAreas[] = $intervalArea * 1000 / 3600;
       }
   }
}

$speed = [0, 20, 30, 34, 40, 40, 40, 40, 30, 10, 20, 30, 30, 32, 31, 30, 20, 10, 20, 40, 70, 73, 73, 73, 40, 20, 0];


$analyzer = new Maps($speed);


echo 'Speeds (km/h): '.implode(', ', $analyzer->getSpeed()).'<br><br>';
echo 'Incrementals (km/h per second): '.implode(', ', $analyzer->getIncrementalList()).'<br><br>';
echo 'Local Maxima Indexes: '.implode(', ', $analyzer->getLocalMaximaIndexes()).'<br><br>';
echo 'Local Maxima (km/h): '.implode(', ', $analyzer->getLocalMaxima()).'<br><br>';
echo 'Interval Areas (meters covered in interval): '.implode(', ', $analyzer->getIntervalAreas()).'<br><br>';
echo 'Max Speed Index: '.$analyzer->getMaxSpeedIndex().'<br>';
echo 'Max Speed (km/h): '.$analyzer->getMaxSpeed().'<br>';
echo 'Max Acceleration Index: '.$analyzer->getMaxAccelerationIndex().'<br>';
echo 'Max Acceleration: '.$analyzer->getMaxAcceleration().' km/h per second<br>';
echo 'Max Deceleration Index: '.$analyzer->getMaxDecelerationIndex().'<br>';
echo 'Max Deceleration: '.$analyzer->getMaxDeceleration().' km/h per second<br>';
echo 'Area below index 2 and 5 (meters covered in 3 seconds from 8.8... to the first 11.1... in 2 decimals): '.$analyzer->areaBelowCurve(2, 5).'<br>';
You can find the code on GitHub in the following repository: https://github.com/dade1987/Learning-Math-Through-PHP
PS The code has been statically validated with PHPStan at the maximum level. It’s formatted with CSFixer.
Addressing problems with wisdom is crucial in every context, both professional and personal.
The availability of appropriate tools can be the key to making this process smoother and more effective. Studying and deepening school subjects provides the intellectual tools necessary to understand and solve problems in various fields.
Dedicating time and energy to studying all subjects at school is crucial to acquiring the skills needed to successfully face future challenges. See you in the next article.
Greetings to all,
Davide Cavallini